Astrocartography Chart Example With Personal Report & AI Report
This synthetic example shows how AstroCarto turns a generated astrocartography chart into report workflows: check real cities, use Find My Best Places to shortlist candidate cities by goal, create a Personal Astrocartography Report, compare selected locations, and see how AI uses calculated evidence instead of inventing map signals.
Synthetic demo report
This synthetic demo shows the structure and depth of a Personal Astrocartography Report without using a real user's birth data. The places, distances, planetary lines, Parans, relocated-chart placements, support signals, cautions, and trade-offs below are example values. A live report is calculated from the user's birth date, birth time, birthplace, generated map, and selected location context.

What This Astrocartography Chart Example Shows
A basic astrocartography map shows where planetary lines fall. This example shows the next step: how a generated chart can be used to check real cities, find candidate places by goal, create a Personal Astrocartography Report, compare selected locations, and generate evidence-backed reports with PDF export and AI follow-up.
Generated chart first
The astrocartography chart and map are the foundation. AI is used after the calculated map exists, not instead of the map.
Create a Personal Astrocartography Report
The example turns chart and location context into a structured personal report with data used, decision verdict, top places, goal verdicts, cautions, and next city checks.
Find candidate cities by goal
Find My Best Places uses the generated chart, selected goal, region, support signals, caution signals, and distance-aware evidence to create a candidate city shortlist before the user compares selected cities in more detail.
AI explains calculated evidence
The report explains the already-computed place analysis and keeps each conclusion connected to its calculated basis. It does not rerank places or invent missing signals.
Demo comparison question
“Which of these selected cities has clearer astrocartography support for career visibility, and what trade-offs should I notice?”
Demo comparison context
Demo comparison context
- Birth data
- Synthetic / hidden
- Birth time confidence
- Exact in this demo
- Selected cities
- London, Berlin, Sydney
- Main goal
- Career comparison
- Best Places goal
- Career shortlist
- Best Places output
- One free preview candidate, then up to 10 candidate cities in the complete report
- Comparison basis
- Calculated line distance, planet, angle, strength, support signals, caution signals, and trade-offs
- Report type
- Personal Astrocartography Report with interactive map, PDF export, and AI follow-up
- AI role
- Explain calculated map or report evidence, not invent new map signals
- Boundary
- Decision support, not certainty
Generated Astrocartography Chart Summary
In this demo, the chart has already been generated from synthetic birth data. The map contains visible AS, DS, MC, and IC planetary lines. The city checks and city comparison below use those calculated line paths as the source of evidence.
Generated Astrocartography Chart Summary
- Chart type
- Astrocartography chart and interactive map
- Calculation source
- Synthetic birth data
- Visible line types
- AS, DS, MC, IC
- City check method
- Compare a city point against calculated planetary line paths
- Best Places method
- Shortlist candidate cities by selected goal and region using calculated support and caution evidence
- Comparison method
- Compare selected cities by goal using calculated support, caution, and trade-off evidence
- Interpretation layer
- Optional AI follow-up, Personal Astrocartography Report, or downloadable Full AI Comparison Report using attached evidence
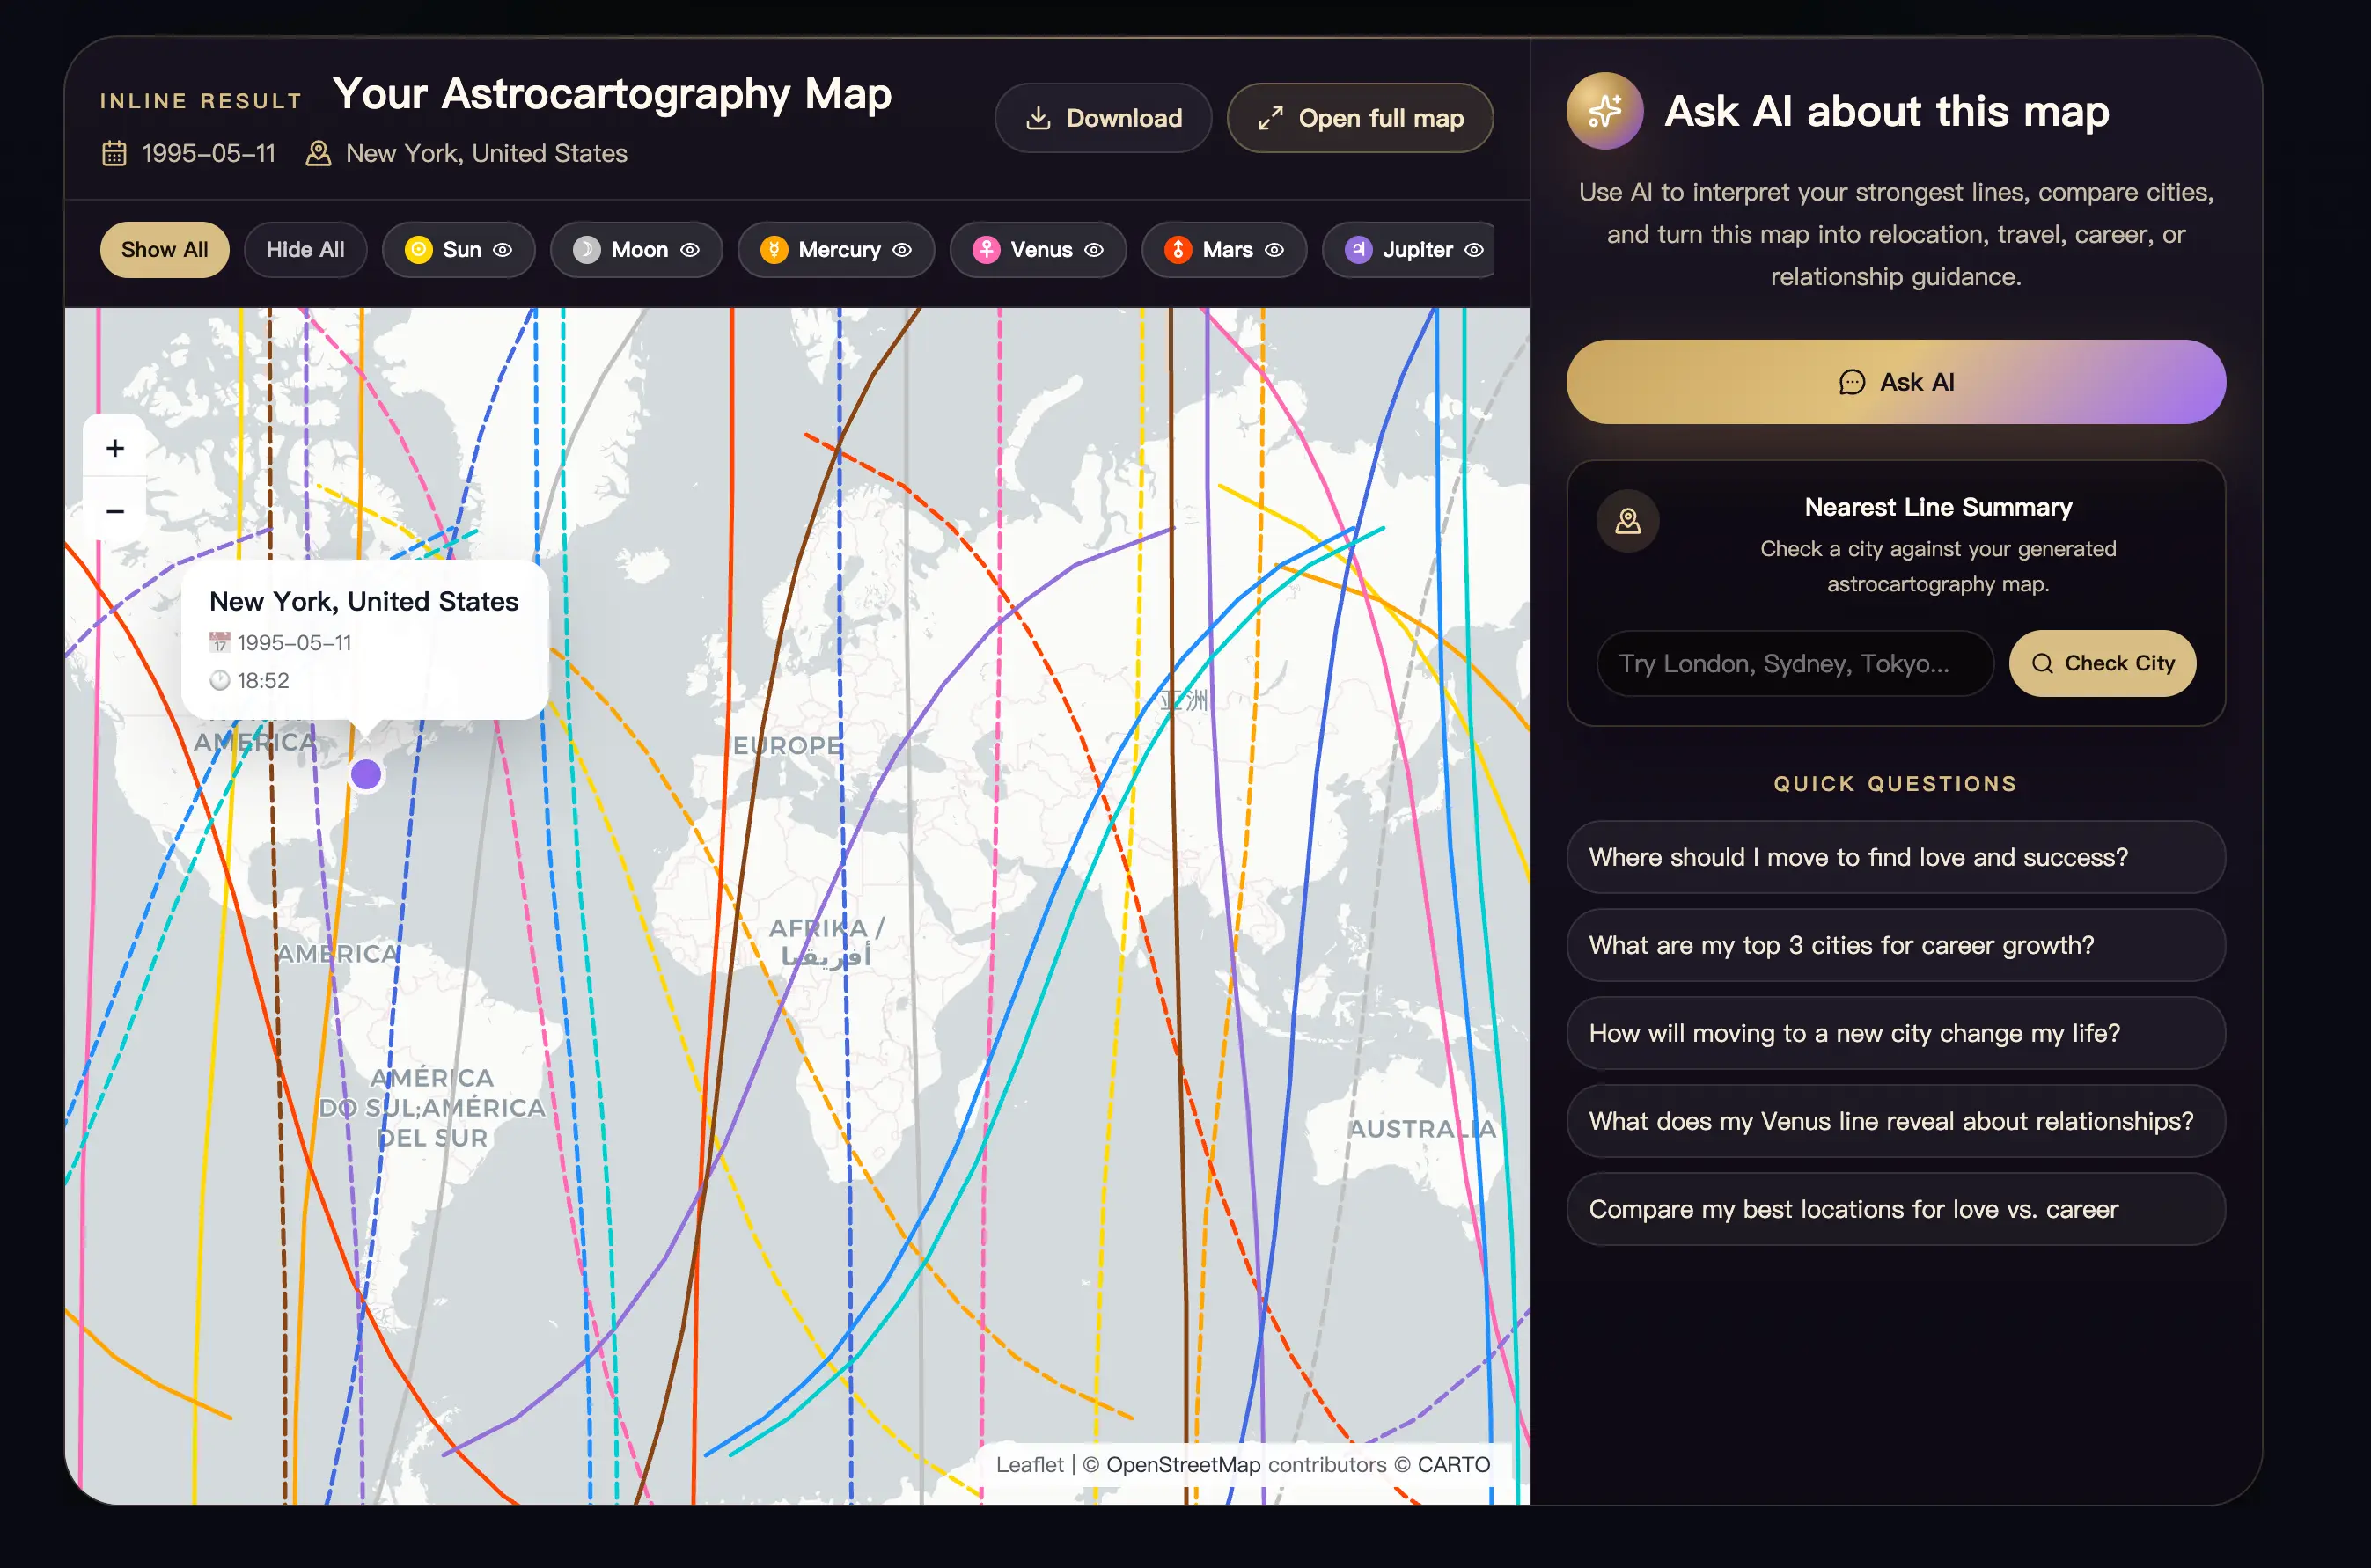
Example generated astrocartography chart and map. Demo data is synthetic.
Personal Astrocartography Report Example
This synthetic Personal Astrocartography Report preview shows how the same generated map can become a structured personal reading before or alongside a city comparison.
Personal Astrocartography Report Example
- Data used
- Synthetic birth data, generated map, London city check, selected career goal, and calculated planetary line evidence.
- Decision verdict
- London is the clearest place to test first for public-facing work in this synthetic example, with a mixed home-life caution.
- Top places
- London, Berlin, and Sydney are listed as ranked places with evidence summaries rather than guaranteed best cities.
- Goal verdicts
- Career is promising, relationships are mixed, home requires caution, and travel remains exploratory in this demo.
- Cautions
- Wide Saturn and Pluto context should be treated as watch-out signals, not as reasons to avoid a place automatically.
- Next city checks
- Check Paris for creative visibility, Amsterdam for social ease, and Vancouver for home stability before deciding.
- PDF and AI follow-up
- The completed report can be downloaded as a PDF and attached to AI follow-up questions for more specific interpretation.
Questions to ask about this Personal Astrocartography Report
This Personal Astrocartography Report preview is synthetic. A live report depends on the user's generated chart, location context, and calculated planetary, Paran, and relocated-chart evidence.
Check Any City Against the Generated Map
After the astrocartography map is generated, the user can check a city instead of estimating line distance by eye. AstroCarto compares the selected city with the visible planetary lines in the generated chart and returns a nearest-line summary.
- City checked
- London, United Kingdom
- Question
- What does London look like for career visibility and relocation?
This is not a best-city ranking. It is a city-to-line summary based on the visible planetary lines in the generated map.
Nearest Line Summary Example
For the selected city, AstroCarto shows the nearest visible planetary lines, approximate distance, strength band, and the main interpretation theme.
London, United Kingdom
Venus MC
Career visibility, public charm, creative reputation
Moon DS
Relationships, emotional response, interpersonal sensitivity
Saturn IC
Home, roots, responsibility, emotional weight
Distance strength bands
| Distance | Strength label |
|---|---|
| 0–120 km | Strong / close |
| 121–250 km | Nearby |
| 251–400 km | Broad |
| 401–644 km | Wide context |
| 645+ km | Weak |
Distance strength is approximate and used as interpretation context. It is not a promise that one location is better than another.
Example values are synthetic and shown to explain the report format. A live result depends on the user's generated astrocartography map.
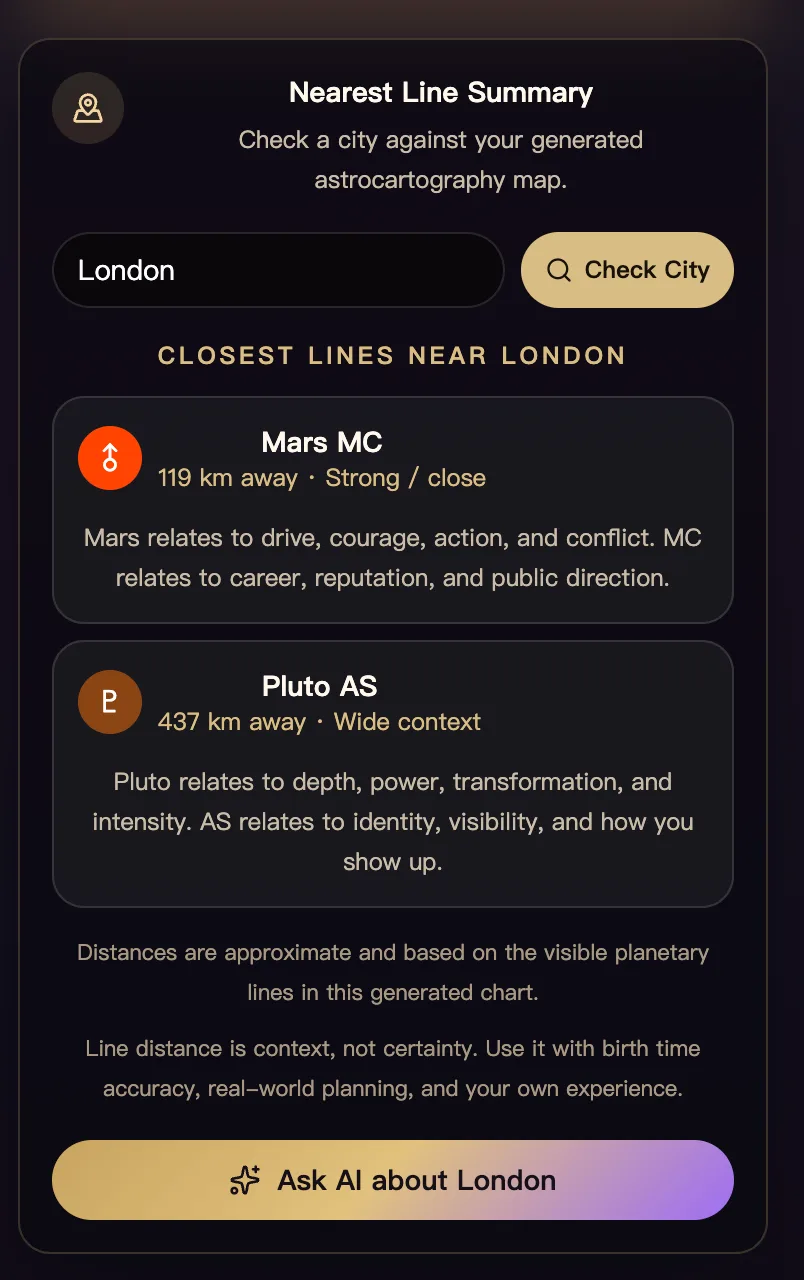
AstroCarto can check a selected city against visible planetary lines and show approximate line distance and strength.
Map Signals Sent With This Question
When the user asks AI from a city check, AstroCarto can attach the same calculated map signals shown in the nearest line summary. Each attached signal can include the city, planet, angle, approximate distance, strength band, and interpretation theme. The AI does not create these signals; they are calculated before the question is sent.
Map signals sent with this question
- Question
- Is London supportive for career visibility?
- City
- London, United Kingdom
Attached map signals
- Venus MC · 128 km · Nearby · career visibility
- Moon DS · 242 km · Broad · relationship sensitivity
- Saturn IC · 398 km · Wide context · home responsibility
Source
Calculated from the generated astrocartography map before the AI answer.
AI uses these map signals as context for interpretation. It does not calculate the line distance, choose a destiny city, invent map signals, or replace practical decision-making.
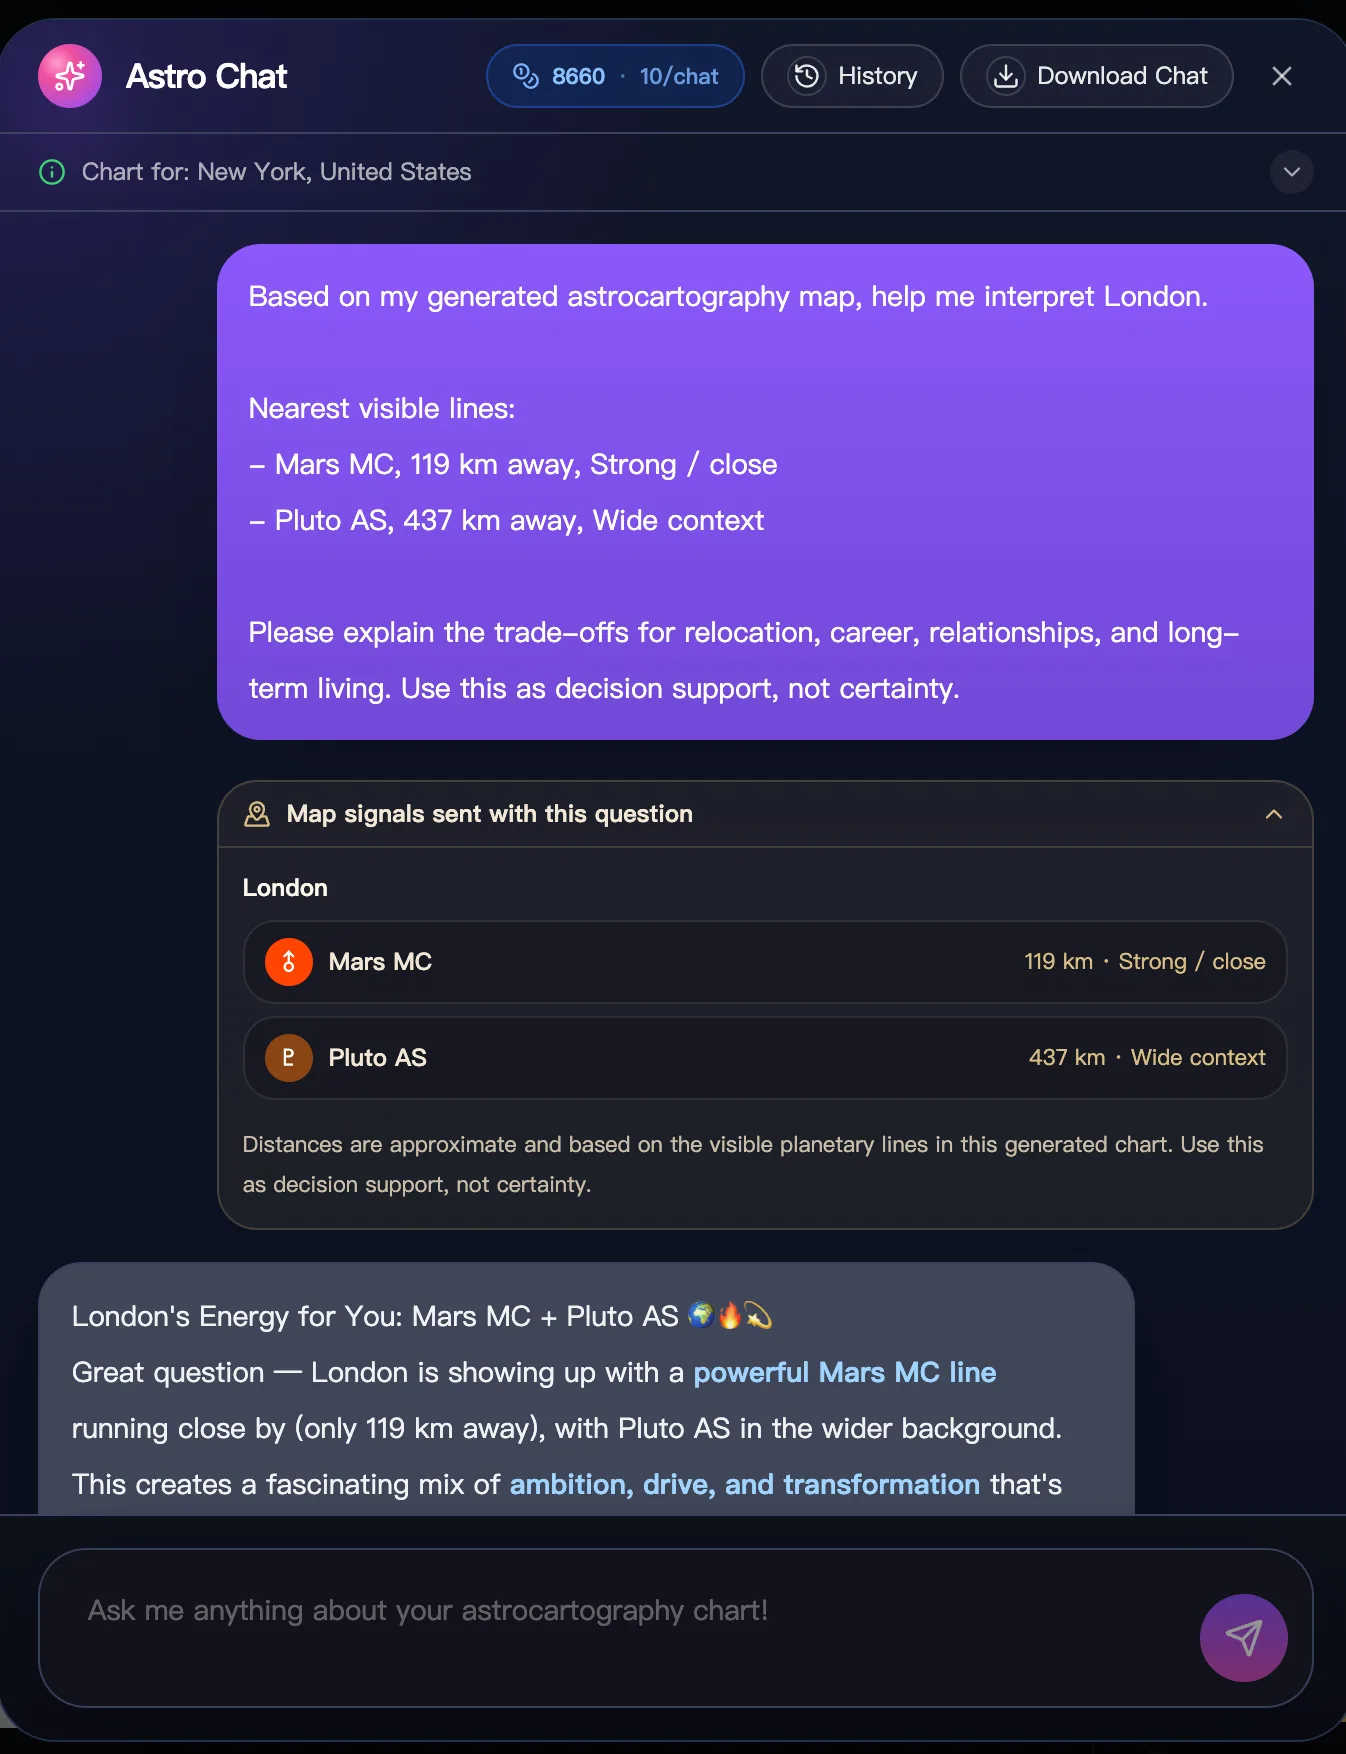
When AI is opened from a city check, AstroCarto can attach calculated map signals before the AI answer is generated.
Example AI Answer Based on Map Signals
Here is a short example of how an AI answer can use attached map signals without pretending to make a final decision.
London looks more supportive for public-facing work and creative visibility in this demo because Venus MC is the closest listed signal. That can point toward professional charm, social ease, reputation-building, and work that benefits from visibility. The Moon DS and Saturn IC signals make the reading more mixed. Moon DS can bring relationship and emotional feedback themes, while Saturn IC can add responsibility around home, roots, or private life. So the example does not say “London is the best city.” It says London has several nearby map signals worth comparing with your real-world goals.
A useful astrocartography reading should be compared with real-world factors such as work, visa status, cost of living, family needs, safety, timing, and health.
Planet Plus Angle Interpretation
Planet Plus Angle Interpretation
London — Venus MC
Venus often relates to harmony, attraction, beauty, social ease, and creative value. MC relates to career, visibility, reputation, and public direction. In this demo, London may support public-facing work, creative reputation, networking, and professional charm. It does not automatically mean easy love because the angle is MC rather than DS.
Sydney — Saturn IC
Saturn often relates to structure, pressure, responsibility, discipline, and long-term building. IC relates to home, roots, private life, and emotional foundations. In this demo, Sydney may support long-term grounding and responsibility, but it may also feel heavier emotionally or more demanding in domestic life.
City Comparison Evidence Overview
City Comparison Evidence Overview
| City | Rank | Main support | Caution signal |
|---|---|---|---|
| London | #1 | Venus MC · 128 km · Nearby | Saturn IC · broad home responsibility context |
| Berlin | #2 | Sun MC · 210 km · Nearby | Pluto MC · intensity and public-pressure context |
| Sydney | #3 | Mercury MC · 260 km · Broad | Saturn IC · strong domestic responsibility context |
This synthetic comparison shows the user-facing calculation basis: place, planetary line, angle, approximate distance, support, and caution. Internal references remain hidden while keeping each report finding traceable.
Trade-Off Matrix Example
Trade-Off Matrix Example
| Decision factor | London | Berlin | Sydney |
|---|---|---|---|
| Career visibility | Clearer public-facing support in this demo because Venus MC is closest | Good visibility support, but more intense or pressure-oriented | Broader communication support rather than a clear front-runner |
| Home and settling in | Some responsibility context from Saturn IC | Less emphasized in this demo | Stronger domestic responsibility signal, but potentially heavier |
| Relationship and social ease | Socially open, but not automatically partnership-focused | More independent and work-focused | More serious or responsibility-oriented |
| Best use | Worth testing for public-facing work, clients, visibility, or creative reputation | Worth testing for ambition, leadership, or high-intensity work | Worth testing for communication, learning, remote work, or disciplined long stays |
The trade-off matrix does not choose a perfect city. It shows how different calculated signals support or complicate the selected goal.
Full AI Comparison Report Preview
The report turns the completed place analysis into a structured interpretation. It explains the existing ranking, separates support from caution, shows the trade-offs behind each place, and gives practical next checks without pretending to make the final relocation decision.
Executive verdict
For the career goal in this synthetic example, London has the clearest calculated support because its Venus MC evidence is closer than the main career-supporting lines in Berlin or Sydney. That makes London the most promising candidate for public-facing work, creative reputation, client relationships, or visibility-oriented career moves in this demo.
Ranking explanation
The ranking is not a general best-city claim. It is based on the selected goal and the available comparison evidence. London ranks first because the closest career-relevant support is Venus MC. Berlin ranks second because Sun MC support is useful but mixed with Pluto MC intensity. Sydney ranks third because Mercury MC is broader and Saturn IC adds stronger home-responsibility context.
City-by-city analysis
London looks easier to test for visible professional work, but the Saturn IC context suggests checking whether home life feels heavy. Berlin may support leadership and ambition, but the Pluto MC evidence makes the public-life tone more intense. Sydney may be useful for communication and structured long stays, but it is less clearly career-forward in this synthetic comparison.
Practical next steps
Use the report as decision support. Compare the astrology evidence with real-world factors such as work options, cost, visas, housing, family needs, health, timing, and personal experience. If one city remains a serious candidate, generate a fresh live comparison with your own birth data and selected cities.
This preview is synthetic. A live Full AI Comparison Report is generated from the user's calculated chart, selected cities, selected goal, evidence list, trade-off matrix, and report basis data. The PDF export uses that completed report content rather than generating a separate interpretation.
What This AI Comparison Report Can and Cannot Tell You
Can tell you
- Which selected city has clearer calculated support for the chosen goal
- Which planetary line, angle, distance, and strength support each interpretation
- Which caution signals or mixed signals deserve attention
- What trade-offs appear between selected cities
- Which calculated signals support each report finding
Cannot tell you
- It cannot guarantee success, love, money, safety, or happiness
- It cannot prove that one city is your destiny
- It cannot replace visa, housing, job, family, health, or safety planning
- It cannot make a final decision for the user
- It cannot invent cities, line distances, or evidence that was not calculated
How to Generate Your Own Astrocartography Reports
- 1Enter your birth date, birth time, and birthplace.
- 2Generate your astrocartography chart and interactive map.
- 3Use Check City to review one city's nearest planetary line evidence.
- 4Open Find My Best Places when you want AstroCarto to shortlist candidate cities for you.
- 5Choose a goal and region for the shortlist.
- 6Review the free one-city preview, then unlock the complete Best Places report when you want the full evidence, PDF, and AI follow-up.
- 7Create a Personal Astrocartography Report when you want a structured reading with top places, cautions, next city checks, and PDF export.
- 8Attach the generated Personal Astrocartography Report to AI follow-up questions when you want deeper interpretation.
- 9Open Compare Cities when you already have 2–4 selected places to compare.
- 10Choose a goal and review support signals, caution signals, trade-offs, and evidence.
- 11Unlock the Full AI Comparison Report when you want a structured interpretation of the selected-city comparison.
- 12Download the PDF when you want a saved copy of the completed report.
Questions to Ask After This Report
Questions to Ask After This Report
Generate Your Own Astrocartography Chart
Use AstroCarto to generate your own astrocartography map, check real cities, use Find My Best Places, compare selected locations by goal, ask AI with report context, and download the PDF when you want a saved copy.